What happens when you score an artist's whole catalog the way an impact evaluator scores a program.
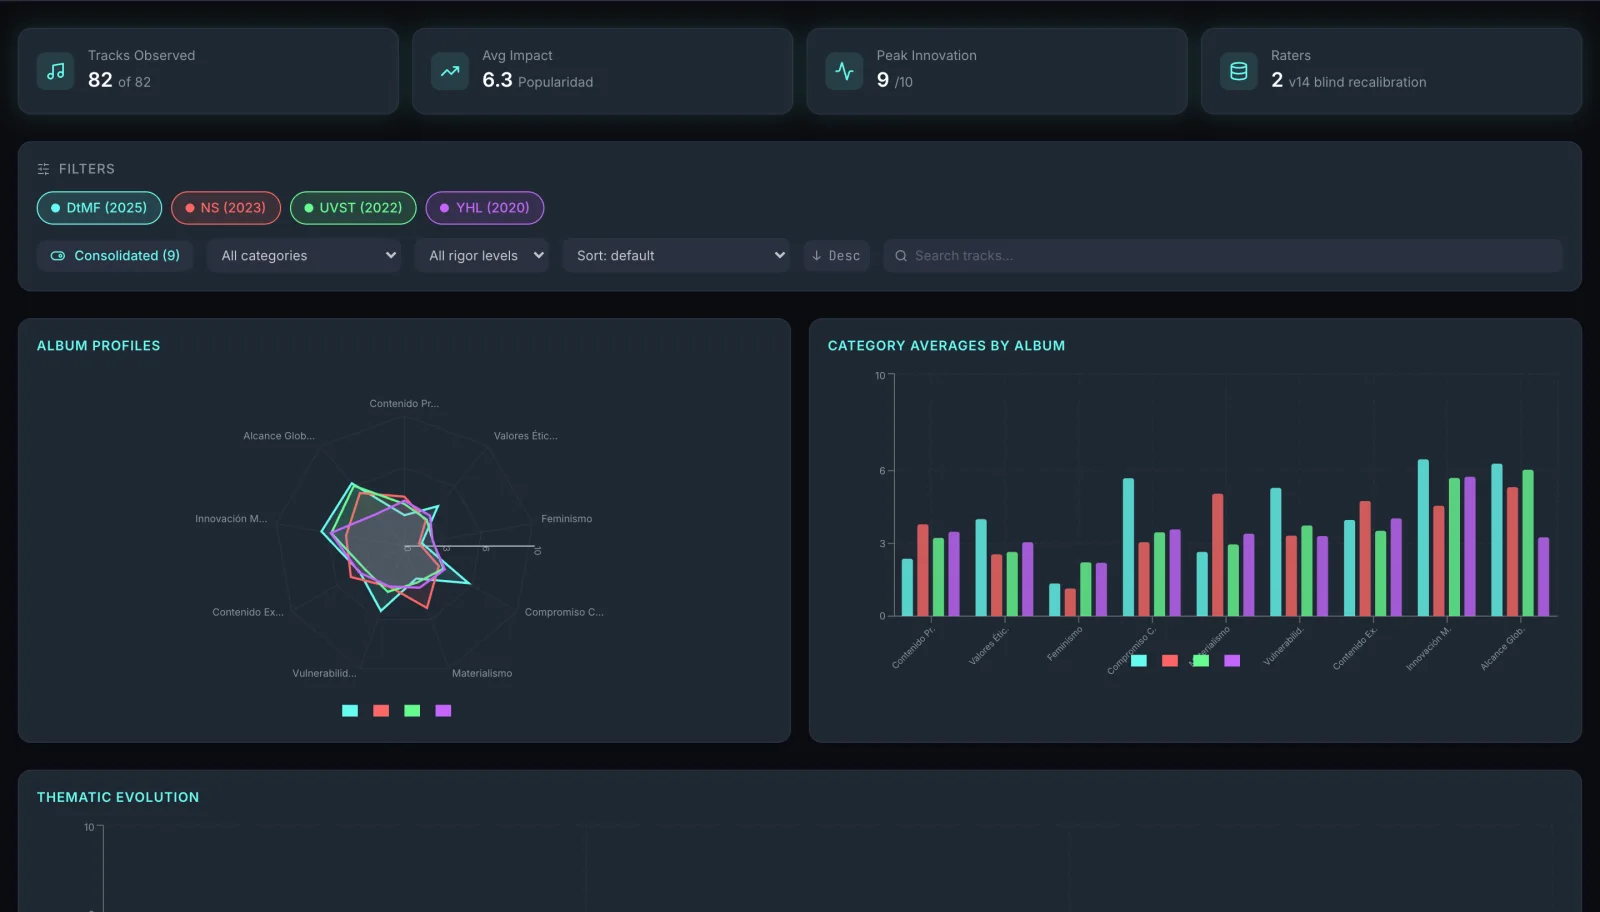
Cultural commentary about music is opinion all the way down. As a research lab exercise, Mutiny Labs asked whether the craft could be measured: how an artist's themes actually move across a career, with a methodology someone could check and challenge.
The discipline is the point. Every track had to be scored against the same validated category definitions, corrections documented, and popularity normalized so streaming impact could sit beside thematic depth without one drowning the other. The result had to be explorable by anyone, not a paper for a drawer.
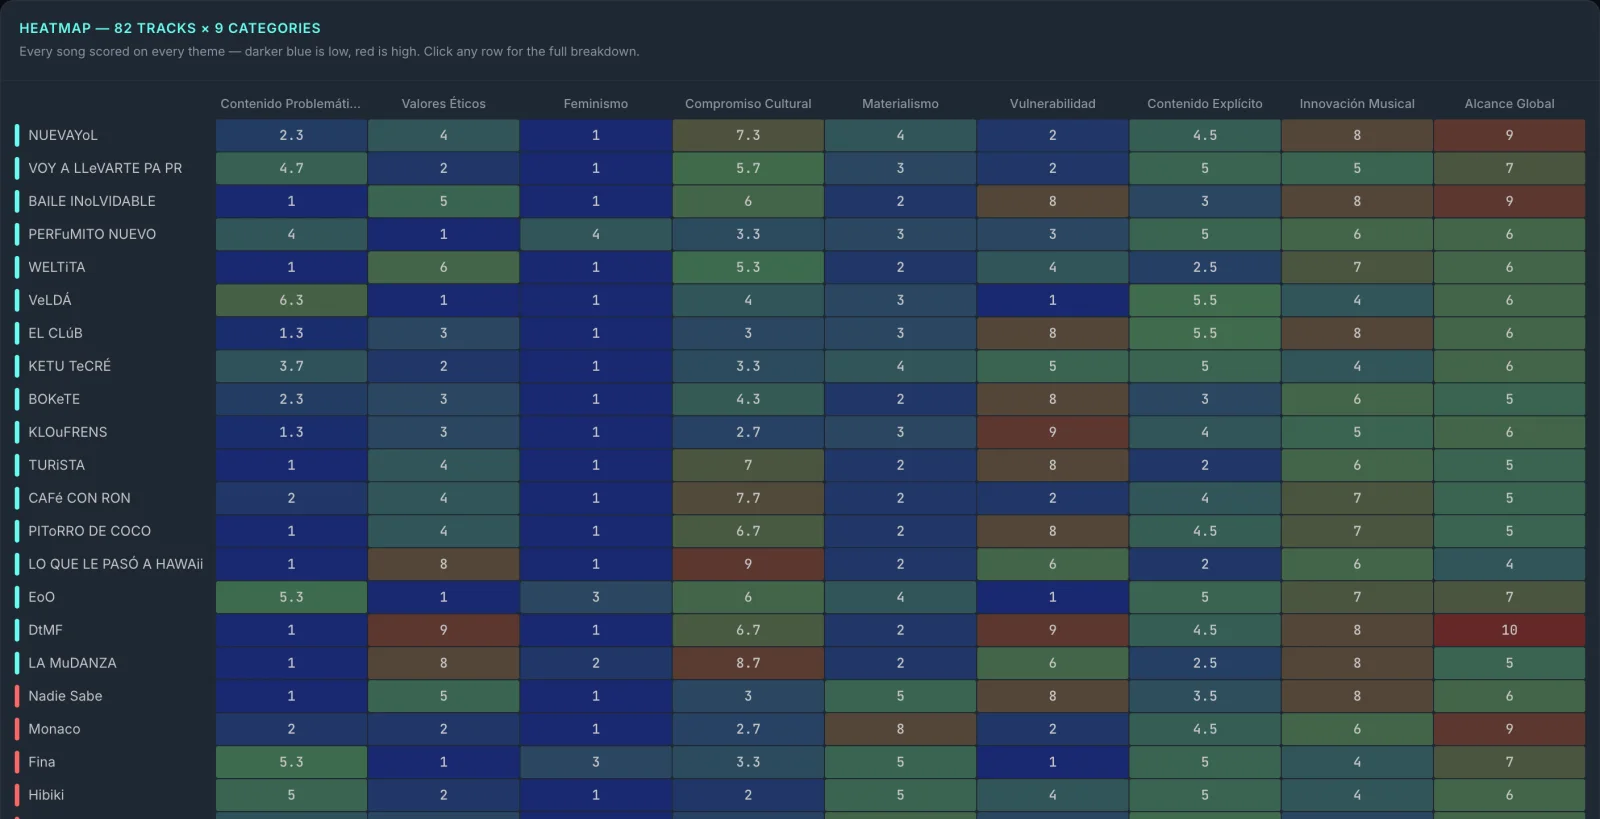
The methodology came first: category definitions were locked and validated before scoring began, every track was scored against the same rubric, and corrections were documented instead of silently overwritten. Then the data got the treatment client work gets: a designed, interactive dashboard rather than a spreadsheet, because analysis that nobody explores persuades nobody.
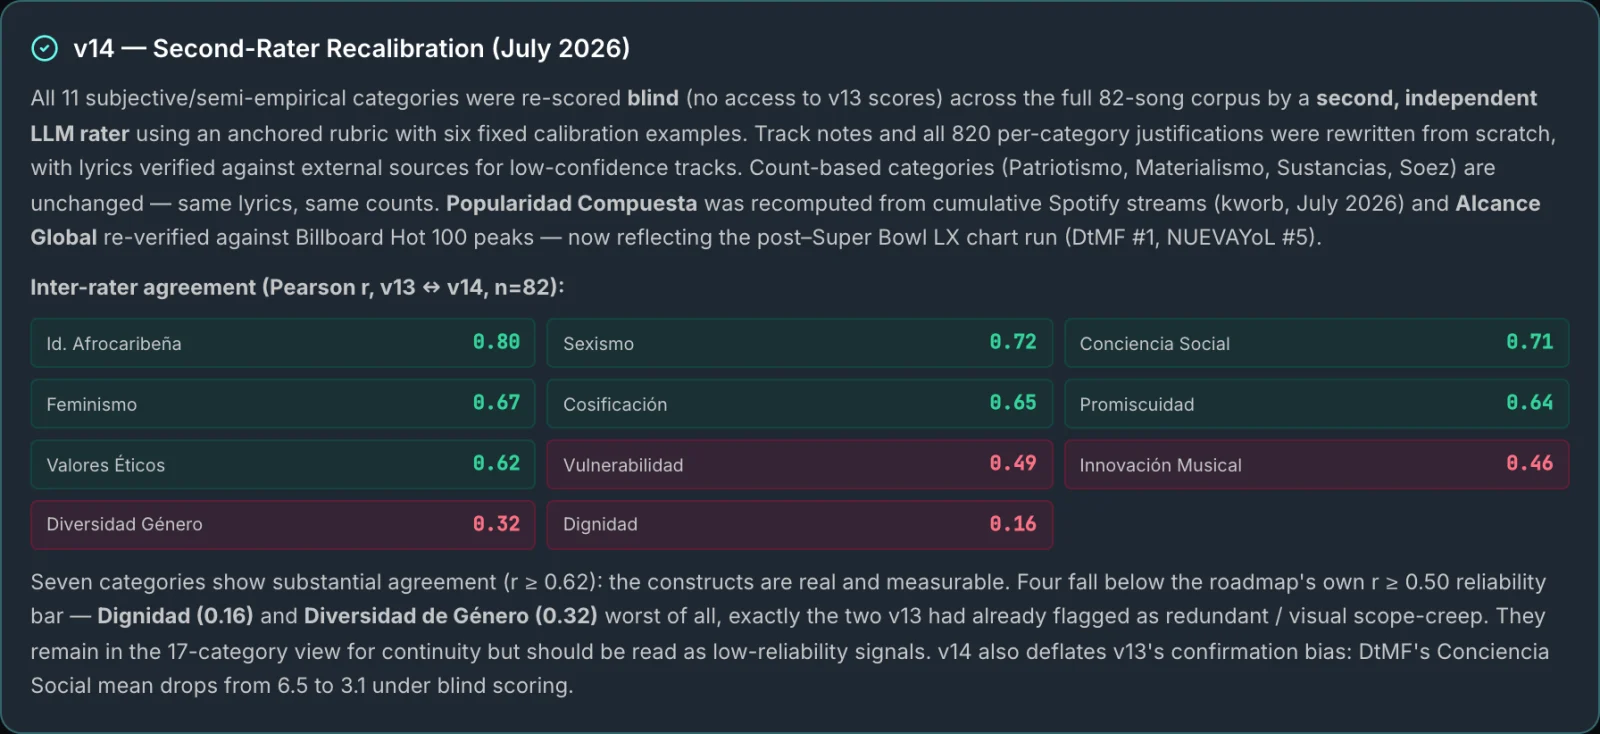
All 82 tracks were scored on a shared rubric, then re-scored blind by a second, independent rater across all 11 subjective categories. Agreement is published per category, not quietly assumed.
Each of the 17 categories carries a declared rigor score, from empirical counts of streams, chart peaks and keywords down to openly subjective reads. The dashboard never lets a soft number pose as a hard one.
A correlation matrix over the full corpus collapsed redundant categories into nine defensible markers. Two that failed the reliability bar were retired from the default view but kept visible as Extended.
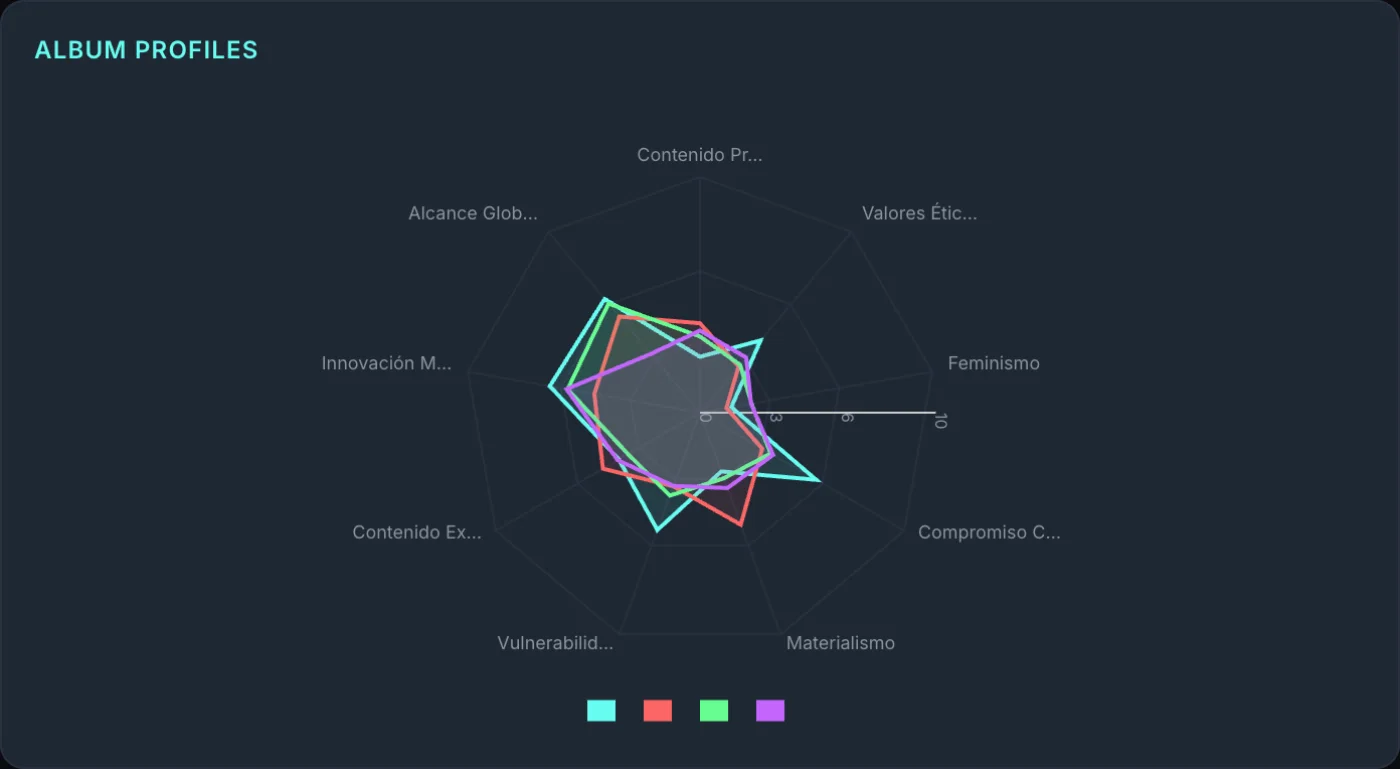
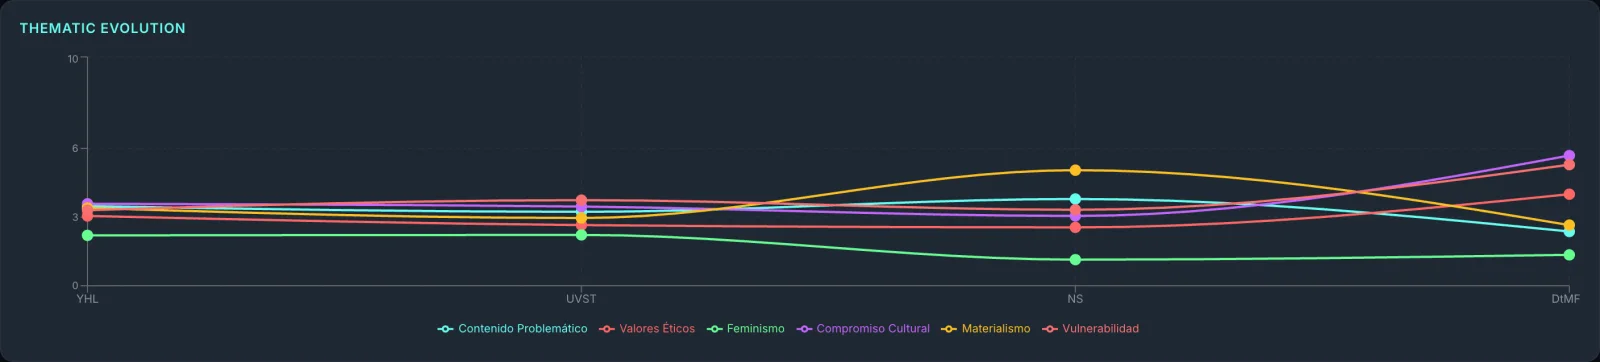
Radar profiles make each era's thematic shape comparable at a glance, and category trajectories across the catalog show what rose, what faded and what stayed constant.
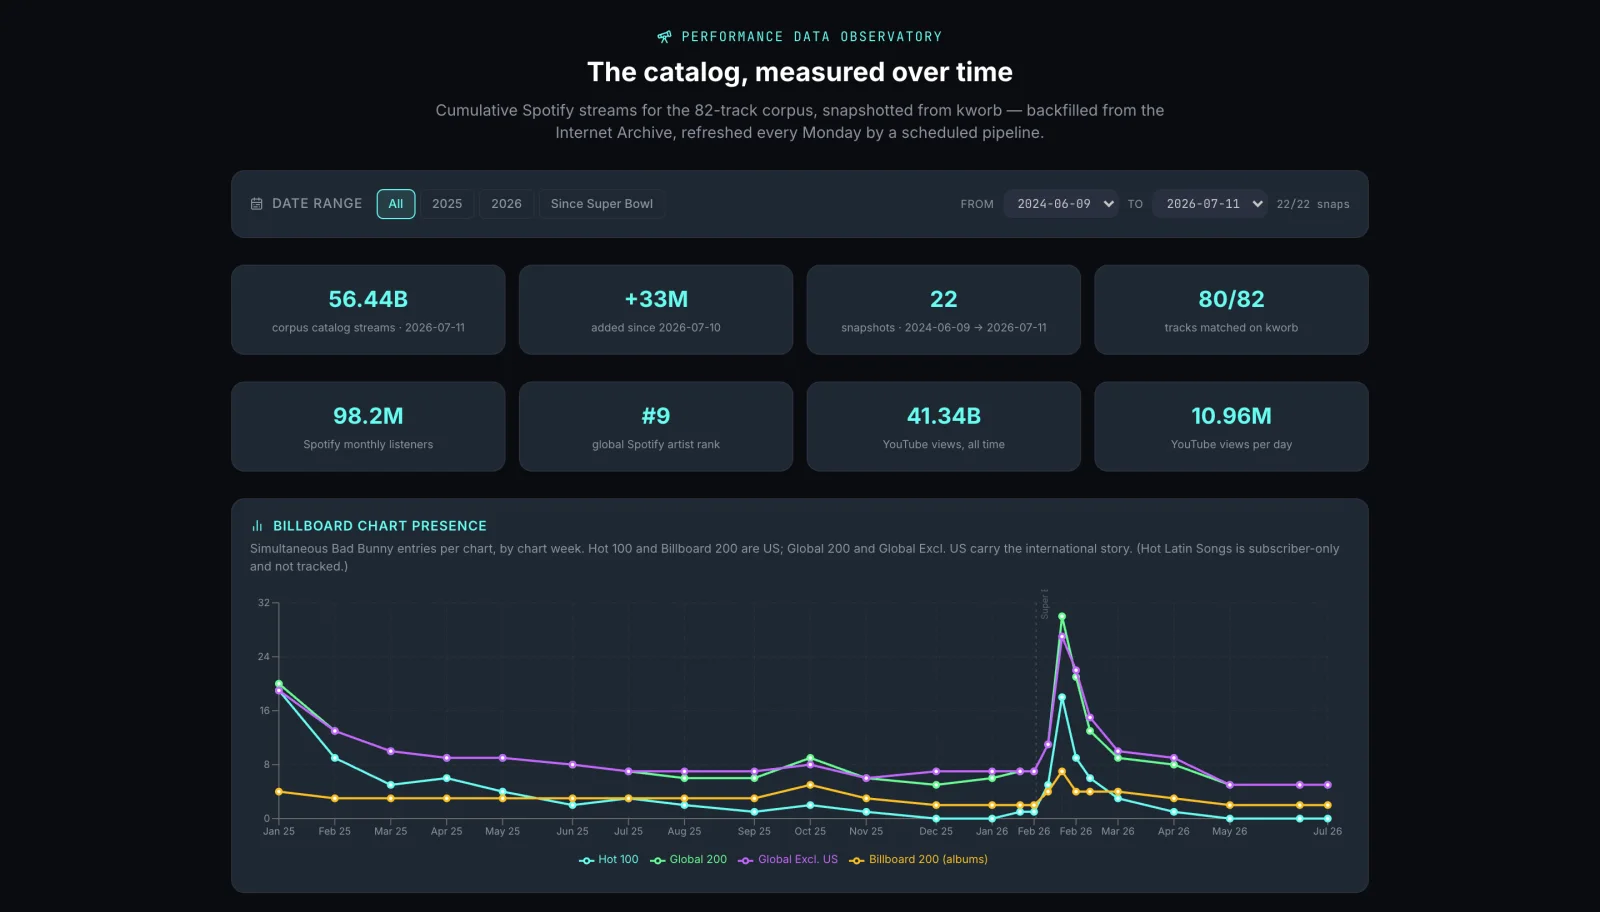
A scheduled pipeline snapshots cumulative streams and Billboard chart presence every week, so the popularity side of the analysis stays current instead of freezing on publish day.
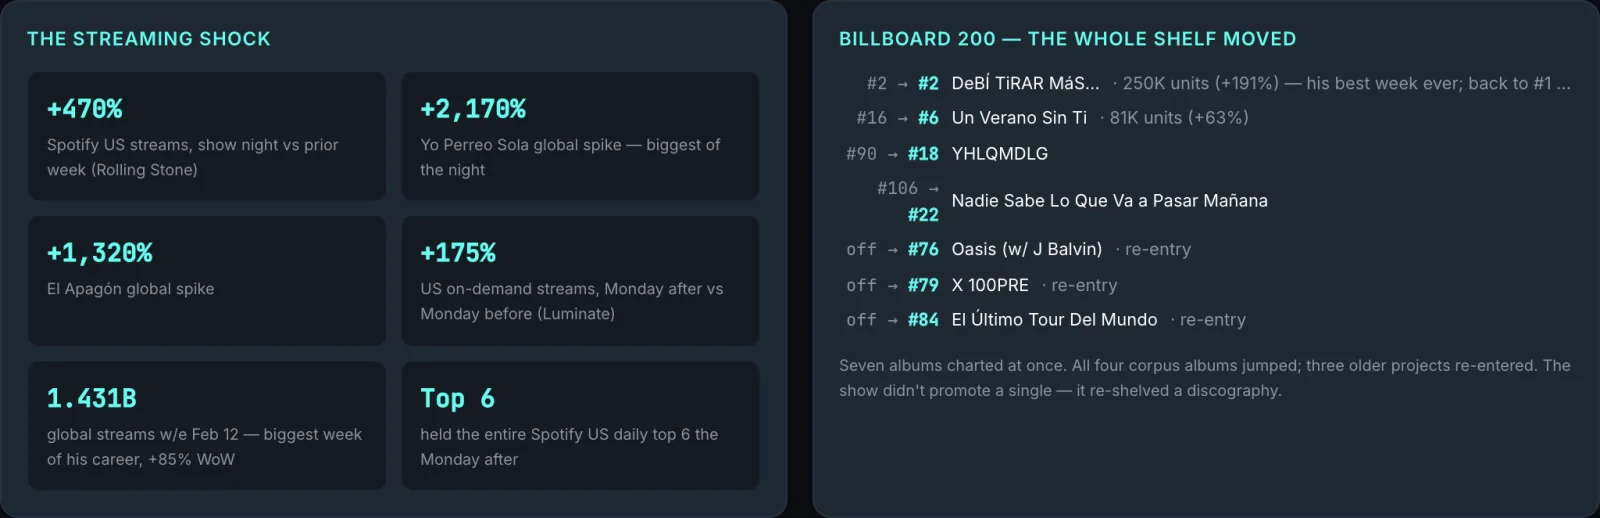
The February 2026 halftime show is read as a natural experiment: a +470% streaming shock, seven albums charting at once, and performed songs outrunning a control group.
Seventeen categories were defined with written criteria and calibration examples before any track was scored, so the framework could not quietly bend toward the thesis.
All 82 tracks were scored on the same rubric with a short justification per category. Corrections were documented, not silently overwritten.
Popularity, chart reach, patriotism, materialism, substances and profanity were moved from impression to counting, each with a published mapping scale.
An independent rater re-scored all 11 subjective categories with no access to the first pass, then agreement was measured category by category.
A correlation matrix across the corpus fused only the markers that genuinely moved together, and retired the two categories that failed the reliability bar.
A scheduled job refreshes cumulative streams and chart presence every week, so the measured side of the story never goes stale.
streamScore is a stepped map of cumulative streams; reachScore is the track's peak chart position. Weighting streaming over a single chart week keeps a catalog favourite from being flattened by one good week.
The higher a track climbed, the higher the score, on a fixed ladder anyone can re-derive from public chart history.
Categories were fused only where the correlation matrix justified it. The problematic-content cluster averaged r̄ ≈ .86, the cultural-engagement cluster r̄ ≈ .65, and explicit content fuses substances and profanity at r ≈ .75.
A raw keyword count would treat a critique the same as a celebration. Weighting each mention by substance and by stance keeps the number honest.
Every subjective category is re-scored blind and its two passes correlated. Seven categories clear r ≥ 0.62; two that fell to .32 and .16 were retired from the default view rather than defended.
The first pass knew the thesis. Re-scoring blind pulled the flagship album's most thesis-friendly category down by more than three points, exactly where you would expect bias to hide.
Methodology, scoring framework and analysis © 2026 Mutiny Labs · mutiny-labs.com.
An independent exploration by Mutiny Labs. Not affiliated with, authorized, or endorsed by Rimas Entertainment, Fundación Rimas, Bad Bunny, or the Good Bunny Foundation. All trademarks, names and music remain the property of their respective owners; this is non-commercial data-journalism commentary.
under the hood: React 18 and TypeScript, an interactive visualization layer, a spreadsheet-to-JSON data pipeline with validation, and a scheduled serverless job that refreshes streaming and chart telemetry every week.
We reply personally. A senior partner, not a sales pod. We'll tell you straight whether we can help.